echarts.apache.org/en/index.html
Apache ECharts (incubating)
ECharts: A Declarative Framework for Rapid Construction of Web-based Visualization Please cite the following paper whenever you use ECharts in your R&D projects, products, research papers, technical reports, news reports, books, presentations, teaching, pa
echarts.apache.org

<!-- prepare a DOM container with width and height -->
<%@ taglib prefix="c" uri="http://java.sun.com/jsp/jstl/core"%>
<%@ page language="java" contentType="text/html; charset=UTF-8"
pageEncoding="UTF-8"%>
<div class="">
<div id="chart" style="width: 600px; height: 400px;"></div>
</div>
<script language="javascript" type="text/javascript">
g_cttPage = (function() {
// 초기 설정 정의
$(document).ready(function() {
fn_initSetting();
});
// 이벤트 정의
function fn_initSetting() {
var params = {};
params["fn_success"] = function(data, params) {
fn_sourceGenSuccess(data, params);
console.log(data);
}
fn_ajax("/echart/inEchart.do", params);
}
;
function fn_sourceGenSuccess(data, params) {
var a = [];
var b = [];
var c = [];
var d = [];
var e = [];
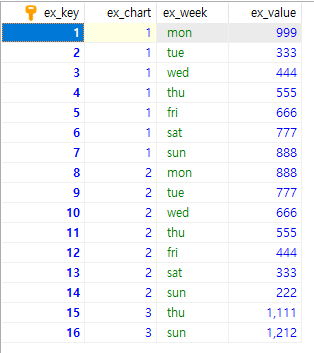
for (var i = 15; i >= 0; i--) {
if (data.result[i].ex_chart == 1) {
d.push(data.result[i].ex_week);
}
}
for (var i = 15; i >= 0; i--) {
if (data.result[i].ex_chart == 1) {
a.push(data.result[i].ex_value);
} else if (data.result[i].ex_chart == 2) {
b.push(data.result[i].ex_value);
} else if (data.result[i].ex_chart == 3) {
c.push(data.result[i].ex_value);
//c.push(data.result[i].ex_week);
}
}
for (var i = 15; i >= 0; i--) {
if (data.result[i].ex_chart == 3) {
e.push(data.result[i].ex_week);
}
}
console.log('a', a);
console.log('b', b);
console.log('c', c[1]);
console.log('e', e[0]);
// based on prepared DOM, initialize echarts instance
var myChart = echarts.init(document.getElementById('chart'));
// specify chart configuration item and data
var option = {
title : {
text : 'ECharts entry example'
},
tooltip : {},
legend : {
data : [ 'Sales' ]
},
xAxis : {
type : 'category',
data : d
},
yAxis : {
type : 'value'
},
series : [ {
data : a,
type : 'line'
}, {
data : b,
type : 'line'
}, {
data : [ [ e[0], c[0] ], [ e[1], c[1] ] ],
type : 'line'
} ]
};
// use configuration item and data specified to show chart
myChart.setOption(option);
}
})();
</script>
위의 초기설정과 이벤트정의 부분은 미리 정의된 함수가 있으니 fn_sourceGenSuccess부분만 참고해야한다.
'플러그인' 카테고리의 다른 글
| dataTable 플러그인 (0) | 2021.05.02 |
|---|---|
| owlCarousel (0) | 2021.05.02 |
| 지도에 화살표와 팝업 띄우기 open layers (https://openlayers.org/) (0) | 2020.09.13 |